Measuring the value of faster block propagation on Ethereum
An independent measurement study of block propagation latency and validator revenue, built from public Xatu and MEV-relay data: the effect of the 4-second attestation deadline on mainnet, a modelled estimate of adoption value, and a deployment analysis on Hoodi, the network where mump2p is deployed.
1 · The deployment study: Hoodi, the network where mump2p runs
mump2p is deployed on the Hoodi testnet (announced June 2025; first published results 2025-09-23). I analyzed 245 days of daily propagation physics on Hoodi itself, scanning for structural breaks rather than assuming a deployment date, alongside within-network designs (per-operator, per-peer, and two that require no adopter labels).
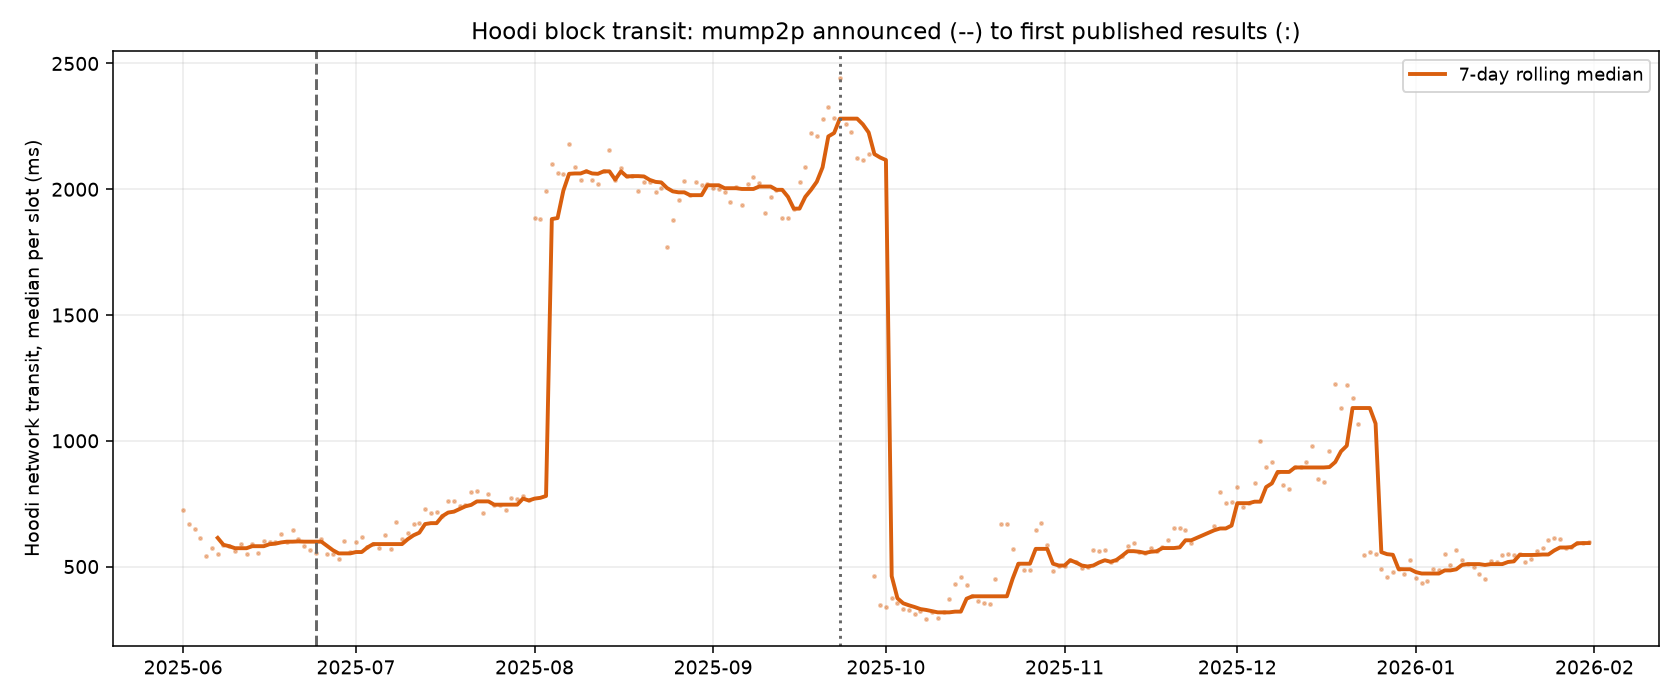
| month (2025) | Hoodi transit (ms) |
|---|---|
| June | 590 |
| July | 700 |
| August (deployment window) | 2,019 |
| September (first results published) | 1,970 |
| October | 434 |
| Nov–Jan | 534–812 |
Findings.
- No adoption-shaped change exists. The one large improvement in Hoodi transit (Sept 29–30, −84% overnight) hit all 14 operator fleets simultaneously: zero staggering across 1.6M proposals. Operators adopt products at different times; simultaneous change is the signature of a network-wide client or infrastructure rollout. Peer-level first-delivery races show no new fast senders in the deployment window either.
- The label-free designs are consistent with this. A size-penalty test (large vs small blocks) moved in the opposite direction from what a constant-time overlay carrying load would produce: the penalty tripled during the deployment window, which is a congestion pattern. And a mixture fit on per-block transit never finds an overlay-speed (~150–300 ms) component in seven months.
- Transit was elevated during the deployment window. Hoodi's transit roughly tripled from Aug 1 to Oct 1 with stable sentry composition, so it is not an observation artifact. I could not attribute the elevation to any specific cause; testnets host many concurrent experiments. Published benchmark comparisons from September–October 2025 therefore reflect a higher gossipsub baseline than Hoodi's typical conditions.
- Testnet and mainnet baselines differ. Hoodi's baseline gossipsub transit (~1,900 ms in mid-2025) is roughly twice mainnet's (~880 ms), so a multiplier measured on Hoodi corresponds to a smaller absolute improvement on mainnet. Section 5 handles this transfer explicitly.
- Current Hoodi data (June 2026): the deadline threshold behaves as on mainnet (95.9% → 77.4% → 40.5% across the deadline); 2.1% of blocks arrive after the deadline versus mainnet's 0.93%, and baseline attestation miss rates are roughly 20× mainnet's, typical differences between a test network and mainnet.
These results are absence of evidence, not proof of no effect, and much of that is by construction. The instrument here is gossipsub-side sentries: overlay deliveries are not directly observable to it, and Hoodi adopters may be gateway operators rather than the validator fleets scanned. Optimum's published methodology states that blocks propagate through both mump2p and gossipsub simultaneously; under that design, consensus-level propagation data would not be expected to change, and the record here is consistent with that description. The null is therefore a statement about consensus-visible propagation, not about the overlay's internal performance. (Break scanning: one least-squares break per series with 21-day guard windows, used descriptively; no significance is claimed for the absence of breaks.)
2 · Mainnet: the effect of arrival time on attestations
Attesters vote when they first see a block or at 4,000 ms into the slot, whichever comes first; 4,000 ms is the moment waiting stops. RANDAO assigns them to slots at random, so exposure to a late block is as-good-as-random: comparing the same validators across early-vs-late blocks is causal, not correlational. From 216,000 mainnet slots:
| block arrival | slots | correct head vote |
|---|---|---|
| < 1s | 1,363 | 99.96% |
| 1–2s | 58,549 | 99.93% |
| 2–3s | 120,027 | 99.67% |
| 3.0–3.5s | 18,818 | 98.82% |
| 3.5–4.0s | 13,615 | 95.89% |
| 4–5s (past deadline) | 1,848 | 67.43% |
| > 5s (pooled; small n) | 222 | 15.8% |
Estimand note: the −28 pp headline is the bin-to-bin drop across the deadline (3.5–4.0s vs 4–5s). The local regression-discontinuity estimate at the cutoff is −11 pp (τ −0.111, se 0.011), smaller because sentry-median measurement error smooths the jump, so the RD is a lower bound. Rows past 5 s are pooled: the underlying bins (157 and 65 slots) are too thin to report separately.
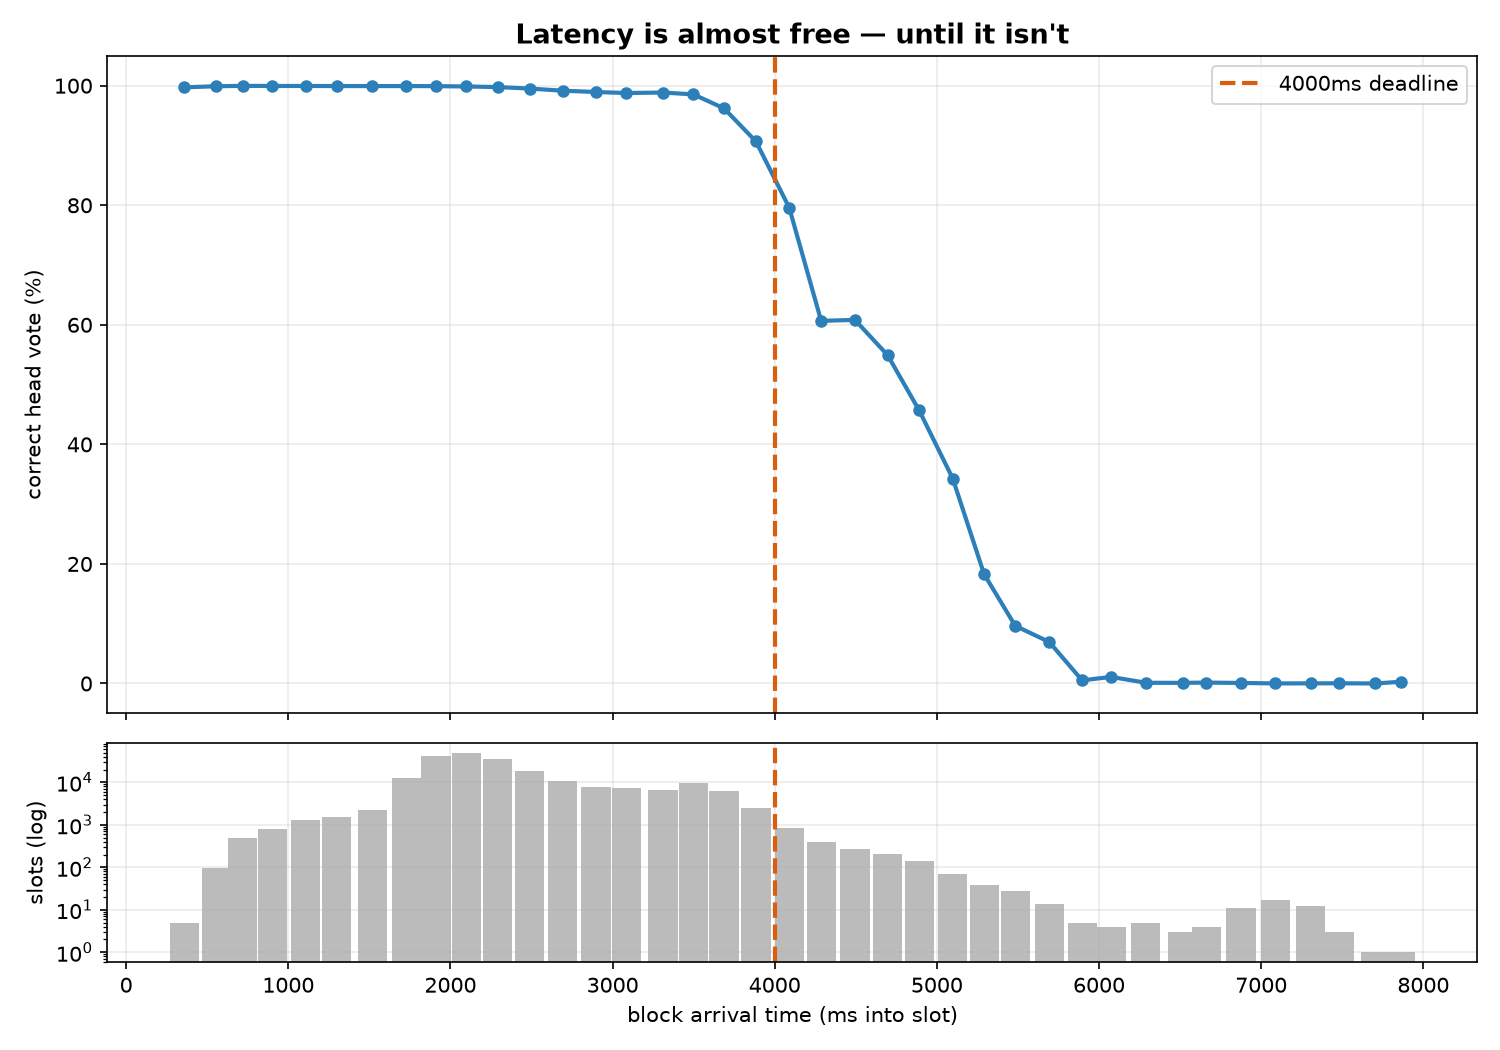
Three observations:
- 61% of head-vote misses happen on blocks that arrived on time (by sentry-median timing; a block on time at the median may still have been late at the specific missing attester; the same smoothing caveat as the RD applies). They are nodes in the propagation tail. The attester benefit of a faster transport is being pulled out of the tail on every block, not rescuing rare late ones.
- Late blocks are published late, not transported slowly. Late blocks' median publication is 3,656 ms (vs 1,811 ms normal); 18% were published after the deadline already. Even an infinitely fast network rescues only ~80% of them; 2× rescues 1.5%.
- Orphaned blocks are published late. 188 orphaned blocks in 30 days; hazard is 0.04% before the deadline, 9.9% at 4.5–5s, 28.5% at 5–6s. Their transit was barely worse than survivors' (482 vs 322 ms); their publication was 2.4s later.
3 · Modelled value of adoption (mainnet)
Four channels, priced from measured quantities. Only network transit (~331 ms for the
median node) is compressible; most of arrival time is the proposer deliberately waiting, which
no transport removes. Totals use A + max(B,C) + D: B and C are mutually exclusive
uses of the same saved milliseconds.
| channel | mechanism | per validator / yr (6×) |
|---|---|---|
| A · attester head votes | my nodes leave the propagation tail on every block | $2.48 |
| B · reorgs avoided | my late blocks survive fork choice | $0.14 |
| C · MEV delay budget | publish Δ later at the same arrival → higher bid value | $29.43 |
| D · bandwidth | RLNC removes redundant gossip (~3.8 TB/node/yr) | $0.68 (cloud) / ~$0.01 (metal) |
~90% of the value is Channel C, and C is an upper bound. Measured from relay bids, a block's value nearly doubles across the slot (0.027 → 0.051 ETH) and plateaus at ~3.5s. C assumes transit is the binding constraint on delay; if relay latency, signing latency, or risk aversion bind instead, a faster transport relaxes none of them, and delaying moves a proposer toward the orphan-hazard curve in §2, a cost not netted out here. The dominant mechanism is therefore additional safe publication time (delay budget) rather than higher average speed. Only 5.8% of proposals currently capture the plateau safely, so headroom exists. Per named partner, at the published 6× figure:
| operator | validators | A $/yr | B $/yr | C $/yr | D $/yr (cloud) | total $/yr | $/day |
|---|---|---|---|---|---|---|---|
| Kiln | 47,500 | 117,923 | 6,402 | 1,397,859 | 32,478 | 1,548,260 | 4,242 |
| P2P.org | 31,862 | 79,100 | 4,294 | 937,654 | 21,880 | 1,038,635 | 2,846 |
| Everstake | 29,300 | 72,740 | 3,949 | 862,258 | 20,171 | 955,169 | 2,617 |
| Ebunker | 11,537 | 28,642 | 1,555 | 339,518 | 7,863 | 376,023 | 1,030 |
| InfStones | 11,500 | 28,550 | 1,550 | 338,429 | 7,863 | 374,842 | 1,027 |
| Blockdaemon | 10,788 | 26,782 | 1,454 | 317,476 | 7,521 | 351,779 | 964 |
| Luganodes | 5,250 | 13,034 | 708 | 154,500 | 3,419 | 170,953 | 468 |
| all seven | 147,737 | 366,770 | 19,911 | 4,347,694 | 100,854 | 4,815,318 | 13,193 |
Assumptions: ETH $1,805.50 (spot at study date, 2026-07; all dollar figures scale linearly with price) · post-Pectra set (40.72M ETH / 880,550 validators, avg 46.2 ETH) · 500 keys/node for D · dV/dt varies with measurement days (7.0–7.8e-6 ETH/ms across June-2025 samples, moving C between $29.43 and $32.76; the lower figure is used throughout for consistency) · scenarios at 3× and 2× run ~$27 and ~$21 per validator/yr. Channel C pays only if the operator re-tunes publication timing; install-and-change-nothing earns ~$2–3.
These are mature-network upper bounds: full receive-side support, no competing adopters. They answer "what is the value if the network supports it." Along the adoption path the numbers are smaller: at the partners' current ~17% adoption, the §4 model scales the all-seven total from $4.8M to ~$1.7M/yr. The two sections are different estimands, not disagreement.
4 · The adoption curve has a sweet spot
Channel C needs receivers (a proposer can only delay safely once ~40% of attesters get blocks fast,
the proposer-boost threshold) and declines as other adopters capture the same marginal order flow. Per-adopter
value = C × min(1, α/40%) × (1−α):
| adoption | per adopter $/yr | non-adopter $/yr | adopt-vs-not spread | all adopters $M/yr |
|---|---|---|---|---|
| 5% | 6.66 | −0.18 | 6.16 | 0.3 |
| ~17% (the seven partners today) | 12.54 | −1.66 | 13.52 | 1.7 |
| 40% (per-adopter peak) | 20.82 | −11.77 | 31.91 | 7.3 |
| 55% (total-value peak) | 16.41 | −16.19 | 31.91 | 7.95 |
| 100% | 3.30 | −29.43 | 32.05 | 2.9 |
- The seven named partners (16.8% of the network) sit below the peak; per-adopter value rises with additional adoption up to roughly 40%.
- The difference between adopting and not adopting stays roughly constant (~$32/validator) across adoption levels, so the individual incentive to adopt persists even as absolute value declines. At 100%, only the non-rival benefits remain (~$3.30/validator).
- Under universal adoption the saved milliseconds are likely spent rather than banked: proposers publish closer to the deadline, which increases sensitivity to disruptions. The durable social value is protocol headroom (more blobs, shorter slots), which accrues to L2s and users, not operators.
- Sensitivity: the peak location tracks the safety-threshold assumption: θ = 20% / 40% / 60% puts the per-adopter peak at 20% / 40% / 50% adoption ($26.71 / $20.82 / $15.43 per validator). The interior-peak shape survives; its position moves with θ.
5 · Extrapolating Hoodi onto mainnet: the floor model
A direct transfer, "6× on Hoodi ⇒ 6× on mainnet", is not supported by the data:
Hoodi's gossipsub baseline is ~2× slower than mainnet's. What an RLNC overlay physically
delivers is not a multiplier but an absolute latency floor (~150 ms at Hoodi
gateways, per Optimum's published figure), and since it runs parallel to gossipsub a node takes whichever
arrives first: transit = min(observed, floor). The same floor buys very
different multipliers on different networks:
| floor | on Hoodi (~1,000 ms baseline) | mainnet median node (331 ms) | mainnet p90 tail (976 ms) |
|---|---|---|---|
| 150 ms (published Hoodi figure) | 6.7× | 2.2× | 6.5× |
| 250 ms (geographic realism) | 4.0× | 1.3× | 3.9× |
| 400 ms (conservative) | 2.5× | 1.0×: no change (parallel overlay, min(observed, floor)) | 2.4× |
Mainnet's median node is already near the floor. At 331 ms typical transit, mainnet gossipsub already operates near the published overlay figure for the typical node; the multiplier is larger where the baseline is slower. What survives the transfer is tail compression: the p90 spread (976 ms → floor) that a proposer must cover before spending delay budget. Priced against the 214k-slot mainnet panel:
| scenario | A · attester $/val/yr | C · MEV $/val/yr | total $/val/yr | all seven $/yr |
|---|---|---|---|---|
| floor 150 ms | 2.30 | 29.77 | 32.06 | 4,736,986 |
| floor 250 ms | 1.88 | 26.58 | 28.46 | 4,203,990 |
| floor 400 ms | 1.14 | 21.67 | 22.81 | 3,370,498 |
| multiplicative 6× model (for comparison) | 2.48 | 29.43 | 32.59 | 4,815,318 |
Carried caveat: the 150 ms input is a gateway-level measurement published by Optimum, captured during the elevated-transit window described in §1, and the eight-month analysis in §1 found no consensus-visible change on Hoodi. This extrapolation prices the figure as if it holds at validator clients on mainnet: an upper bound built on an input I could not verify independently.
6 · Recalibrated: the network then vs now
Every model here was first calibrated on June-2025 data. Re-measured on a fresh panel (2026-06-25 → 07-08, 97,137 slots, post-Fusaka) the physics replicates, and the economics changed substantially:
| metric | 2025-06 | 2026-07 | drift |
|---|---|---|---|
| median-node transit | 331 ms | 318 ms | −4% |
| p90 spread (proposer-relevant) | 976 ms | 802 ms | −18% |
| blocks past the 4s deadline | 0.96% | 0.38% | −61% |
| head-miss rate | 0.94% | 0.62% | −34% |
| dose-response cliff (4–5s bucket) | 67.4% | 63.3% | intact |
| dV/dt: value of 1 ms of delay | 7.0–7.8e-6 ETH | 1.1e-6 ETH | −85% |
| mean block value | 0.048 ETH | 0.031 ETH | −35% |
| modelled uplift, $/validator/yr @6× (A+C+D) | $32.59 | $6.68 | −80% |
| all seven partners, $/yr @6× | ~$4.8M | ~$1.0M | −80% |
Two findings. First, the causal physics replicates a year out of sample: the cliff sits exactly at the spec deadline, the RD estimate is within noise of 2025 (τ −0.111 vs −0.124). Second, the modelled value declined for two independent reasons: post-Fusaka gossipsub is faster (late blocks −61%, so less latency to remove) and the market value of publication delay fell (dV/dt −86%). June-2025 conditions were near the high end of the modelled value; at current conditions the published 6× figure corresponds to $6.68 per validator per year ($4.75 at 2×). An important limit on this comparison: it rests on two single-month windows a year apart, and MEV is heavy-tailed and bursty; read it as the observed range of a regime-dependent quantity, not as a trend. A month-by-month dV/dt series across the intervening year is the natural extension and has not yet been computed. The live ticker below runs on the fresh calibration.
7 · What is observed, what is inferred
Claims on this page fall into distinct evidence classes. Stating them explicitly:
| claim | basis | class | confidence |
|---|---|---|---|
| Attestation threshold at 4,000 ms (−25 pp) | 216k mainnet slots; replicated on a 2026 panel and in on-chain attestation records | observed | high |
| 61% of head misses occur on on-time blocks | same panel, attester-weighted | observed | high |
| Late blocks are published late (3.65 s vs 1.81 s) | sentry first-sighting decomposition | observed | high |
| Bid value rises ~2× across the slot, plateaus ~3.5 s | MEV relay bid traces | observed | high |
| mump2p runs on Hoodi in shadow mode alongside gossipsub | Optimum's published methodology | published by Optimum | — |
| 150 ms gateway delivery; 6× vs gossipsub | Optimum's published Hoodi benchmark; not independently verifiable from public data | published by Optimum | unverified |
| No propagation change attributable to mump2p on Hoodi | null results across five designs (245 days) | observed absence | high for the data; consistent with shadow mode |
| Cause of the Aug–Oct 2025 Hoodi transit elevation | unattributed; testnets host concurrent experiments | unknown | low |
| Channel C mechanism (delay budget → bid value) | measured V(t) slope + consensus-spec deadline | inference | high |
| Floor transfer model (overlay = latency floor) | RLNC constant-time delivery property; scenario-bracketed 150/250/400 ms | model | medium |
| Adoption curve (θ≈40% ramp, 1−α decline) | proposer-boost fork-choice arithmetic + flow-conservation argument | model | medium–low |
| 2025→2026 decline in modelled value | two one-month calibration windows in a heavy-tailed MEV market | observed range | low–medium as a trend |
| Fleet node counts (500 keys/node), operator fleet sizes | stated assumptions; public registries where available | assumption | medium |
8 · Live counterfactual ticker
A tracker on this server polls the mainnet beacon head (NTP-corrected), times every real slot, and accrues the modelled uplift slot-by-slot. Same model, live data:
Full per-operator live view on the dashboard · methods companion: the five-step notebook write-up; note it is the v1 walkthrough on a one-day pilot panel (7,200 slots); where its numbers differ from this page, this page supersedes them.
9 · Questions I would want to discuss
- How does gateway-level delivery (the Qmump2p(80%) measurement) map to arrival at validator consensus clients; is there instrumentation at the client boundary?
- What did the mump2p-vs-gossipsub gap look like on Hoodi outside the elevated-transit window of Aug–Oct 2025? A quieter-period comparison would sharpen the transfer estimate in §5.
- In the APR calculator's operator regression, how much of the latency coefficient survives controlling for relay connectivity and getHeader timing? My bid-curve estimate suggests the residual is the part both approaches already agree on.
- Under PeerDAS, blobs dominate gossip payload and distribution is re-architected; how does RLNC interact with data-column sampling, and does the bandwidth channel (§3, channel D) grow or shrink?
- The adoption model assumes a proposer needs ~40% of attesters on fast receive before spending delay budget. Does a gateway mesh change that threshold, and would a staggered pilot across operators (which would also enable the difference-in-differences this page could not run) be feasible?
Methods & sources. All data public: ethPandaOps Xatu parquet (mainnet, hoodi; canonical blocks, sentry block-sighting events, elaborated attestations, committees, MEV relay bid traces & delivered payloads). Mainnet panel 2025-06-01→30 (216,000 slots); Hoodi event panel 2025-06-01→2026-01-31 (245 days); MEV accrual curve from relay bid traces; orphan values validated against relay delivered payloads (orphans carry 1.02× average value). Analysis: DuckDB + Python; ~60 unit tests including planted-effect recovery and null-size checks.
Stated limitations. Arrival is a sentry-median, so per-attester measurement error smooths the deadline discontinuity; sharp-RD estimates are bandwidth-sensitive and I lead with the dose-response instead. The 6× speedup is a published testnet measurement, not a mainnet one (hence the 3× and 2× scenarios). Fleet node counts and the 40% safety threshold are stated assumptions. Hoodi results are no evidence of effect under a shadow-mode deployment, not proof of none.
Scope. This page prices mump2p only through Ethereum validator consensus and MEV revenue. Other chains and non-validator latency applications are out of scope and not evaluated here.
Generated from the optimum research pipeline · reproducible end-to-end from
public data · code available on request.
10 · Month-by-month uplift by partner
This extends the single-month calibrations above to every month the model can price: September 2024 (the start of Xatu's MEV relay bid coverage) through July 2026. Each line is one partner's modeled uplift run-rate, recomputed monthly from that month's measured network physics and MEV bid curve. The per-validator uplift is the same for every operator, so the lines are fleet-size multiples of one curve. Two adoption frames, one chart each:
First-mover frame. Only the seven partners adopt (16.8% of the network). The proposer delays by exactly the transit time the 6× overlay saves, so the p90 attester sees the block no later than today and no competitor games back. This is the frame behind the June-2025 and July-2026 figures elsewhere on this page.
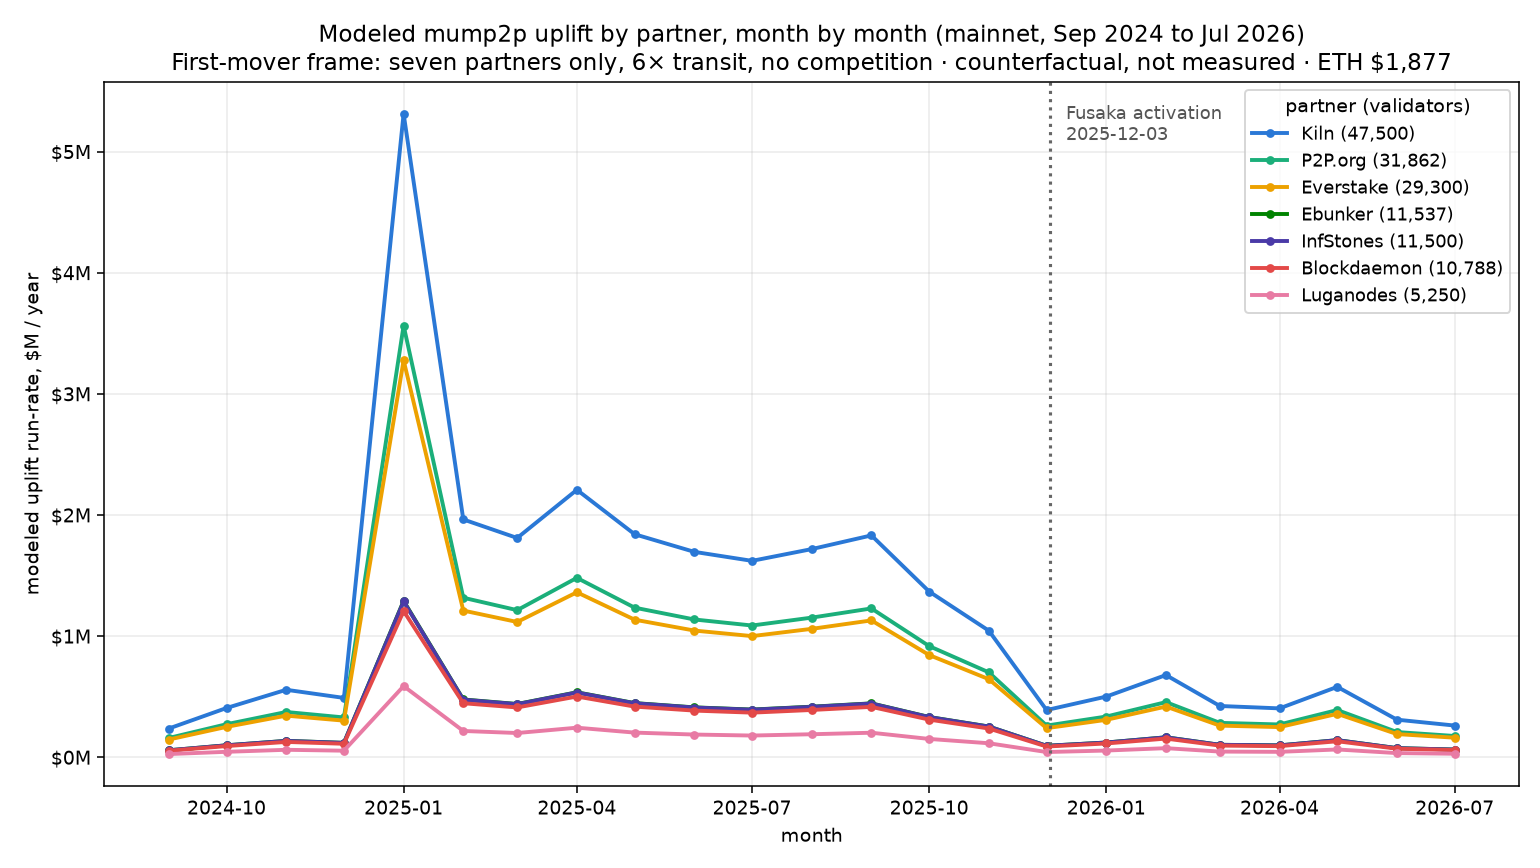
50% network adoption. Half the network adopts. That cuts both ways: with half the committee on the fast receive path the 40% safety threshold is met outright, so the safe delay extends to the bid plateau at 3,500 ms; but competing adopters' timing games claw back flow, scaling realized value by (1 − α). The two effects nearly cancel: the peak trims from $16.5M/yr to $14.6M/yr across all seven, while the post-Fusaka 2026 months come out slightly higher because earlier publication widens the plateau-capped delay window.
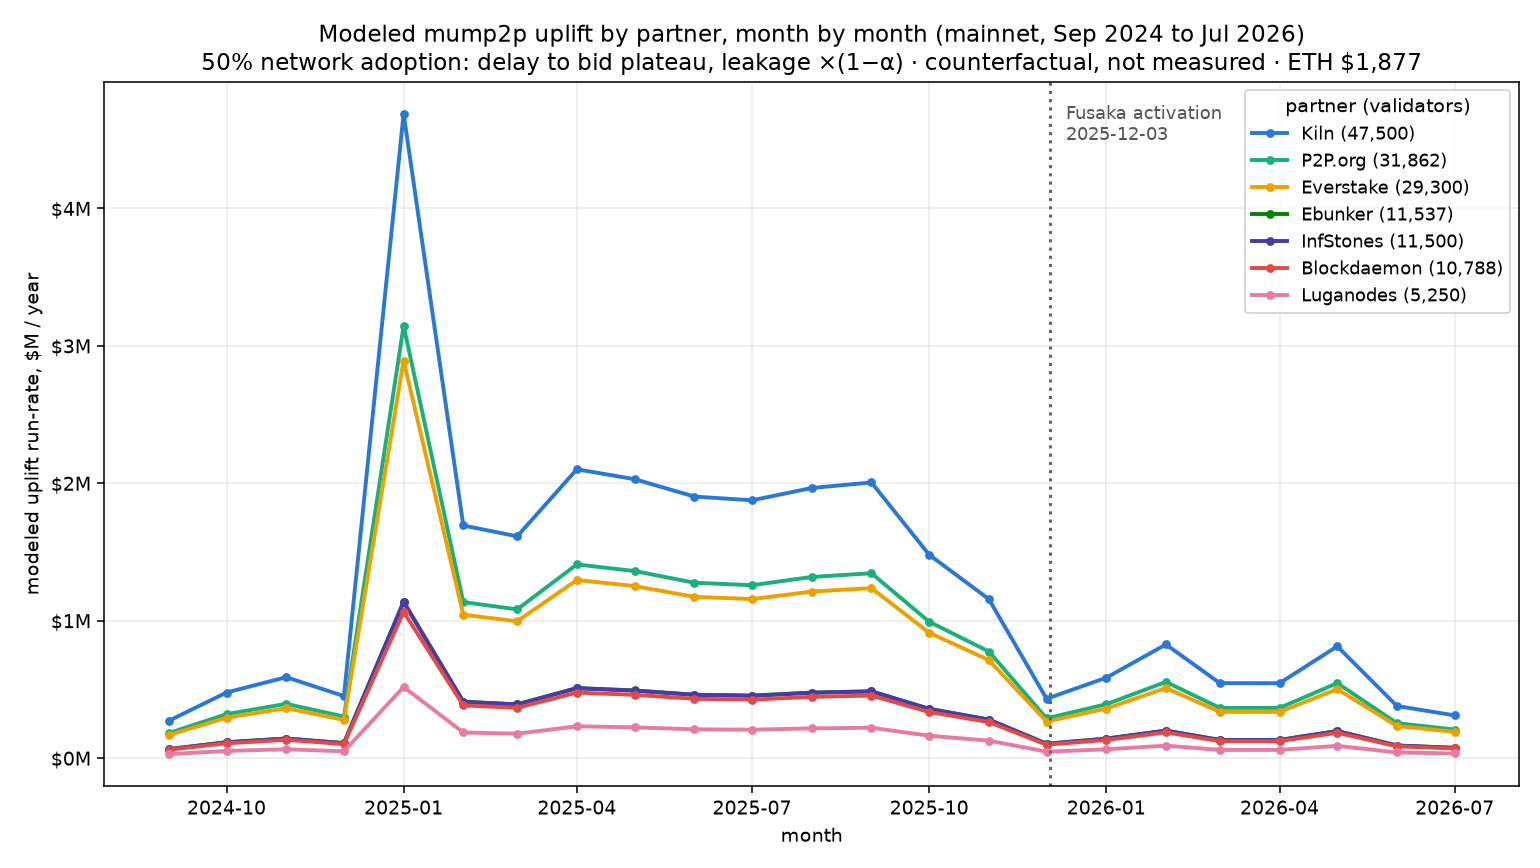
The shape common to both is the finding: the value of latency is set by the MEV regime, which swung roughly 30× across the window. The dotted line marks the Fusaka hard fork (2025-12-03): daily data shows median publication stepping down about 250 ms beginning the day after activation, while the MEV decline was already underway from September 2025, so the fork coincides with the final leg of the drop rather than starting it. All values are counterfactual model output, not measured revenue, with ETH held at $1,877 and the attester and bandwidth channels fixed at $2.88 per validator per year.